Chapter 1: What is Quasimodo (QML)?
If you have studied basic Price Action, you are likely familiar with classic reversal patterns such as the Double Top or Head & Shoulders. However, in reality, financial institutions (Smart Money) are well aware that retail traders heavily rely on these patterns. As a result, they actively create "price traps" to hunt retail Stop Losses.
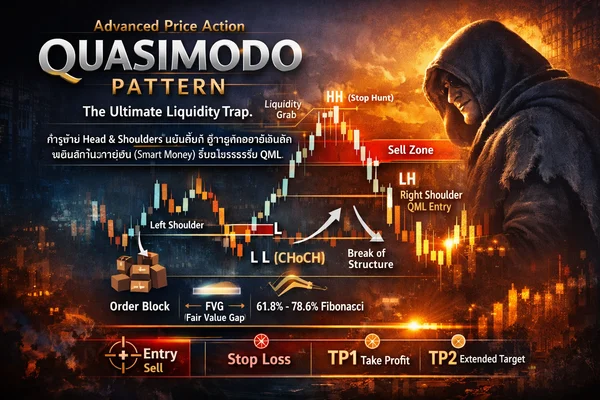
The Quasimodo Pattern, or QML (Quasimodo Level), is a structural price pattern that perfectly reflects market manipulation. Inspired by the hunchback character of Notre Dame, the pattern is characterized by its conspicuously "uneven" left and right shoulders. Ironically, this asymmetrical deformity is exactly what gives it one of the highest win rates among all reversal patterns.
Chapter 2: Anatomy of QML
A valid Quasimodo Pattern must consist of exactly 5 specific structural Swing High and Swing Low points. If any of these points are missing or out of sequence, the setup is invalid.
Bearish QML
Occurs at the end of an uptrend, signaling a bearish reversal. The sequence must be:
- 1. High (H) The Left Shoulder
- 2. Low (L) The Swing Base
- 3. Higher High (HH) The Head (Liquidity Sweep)
- 4. Lower Low (LL) The Structure Break (CHoCH)
- 5. Lower High (LH) The Right Shoulder (Entry)
Bullish QML
Occurs at the end of a downtrend, signaling a bullish reversal. The sequence must be:
- 1. Low (L) The Left Shoulder
- 2. High (H) The Swing Peak
- 3. Lower Low (LL) The Head (Liquidity Sweep)
- 4. Higher High (HH) The Structure Break (CHoCH)
- 5. Higher Low (HL) The Right Shoulder (Entry)
Chapter 3: QML vs Head & Shoulders
To the untrained eye, these two patterns look identical. However, the "Neckline" is the ultimate deciding factor that separates retail targets from institutional hunters.
Classic Head & Shoulders
The left and right shoulders are usually symmetrical. More importantly, the neckline is horizontal (the two base lows are equal). Breakouts of a standard H&S neckline are notoriously prone to Fakeouts, actively trapping retail traders.
Quasimodo (QML)
QML completely ignores horizontal necklines. Instead, it demands a violent Break of Structure. The downward impulse from the Head (HH) must plunge below the previous base to create a strict Lower Low (LL). This physically proves that sellers have seized total control (Change of Character).
Chapter 4: The Psychology (SMC Logic)
When we dissect the QML through the lens of Smart Money Concepts (SMC), we understand exactly why the chart draws this shape. It is a premeditated algorithmic masterplan.
-
1The Inducement (Left Shoulder)
Institutions engineer a local High to induce retail traders into believing a strong Resistance exists. Retail starts selling, stacking their Stop Losses just above this High (creating a dense Liquidity Pool).
-
2The Sweep (Head / Higher High)
Price violently spikes upward (often during a news event) to hunt the retail Buy Stops above the left shoulder. Smart Money uses these triggered Buy Stops to fill their massive institutional Sell Limits.
-
3The Dump & CHoCH (Lower Low)
With their orders filled, institutions aggressively dump the market, causing price to crash below the original base (forming a Change of Character). Retail breakout buyers who jumped in at the Head are now trapped in heavy drawdown.
-
4The Mitigation (Right Shoulder / Entry)
Price lazily retraces back to the level of the left shoulder (the QML Level). This allows institutions to mitigate any underwater positions, providing us with the perfect Sell entry alongside Smart Money.
Chapter 5: Finding Confluence for High Win Rates
Trading a QML line blindly can still lead to drawdowns. Professional traders always pair the QML level with other institutional tools to filter out market noise and confirm the setup.
-
Supply/Demand & Order Blocks (OB) Look for the last opposing candlestick (Order Block) formed right before the push to the Head. If this OB aligns perfectly horizontally with the Left Shoulder, it becomes a Golden Level with tremendous reactive power.
-
Fair Value Gaps (FVG) / Imbalance If the downward impulse that created the Lower Low left behind a massive Fair Value Gap (FVG) just before the QML line, it acts as a magnet, accelerating the price back up to mitigate the zone.
-
Fibonacci Retracement Pulling a Fibonacci from the Head (HH) down to the bottom (LL). The right shoulder often converges precisely at the 61.8%, 78.6%, or 88.6% deep retracement levels.
Chapter 6: Setup & Execution
Once a structurally perfect QML is identified, the next critical step is defining strict parameters for your Entry, Stop Loss, and Take Profit.
🎯 The Entry
Aggressive (Pending Order): Place a Sell Limit exactly at the price level of the Left Shoulder.
Conservative (Confirmation): Wait for price to tap the QML level and execute only when a clear Price Action rejection forms (e.g., Pin Bar or Engulfing).
🛡️ The Stop Loss (SL)
Maximum Safety: Place your SL slightly above the Head (Higher High). Add the broker's spread plus 1-2 ATR to prevent secondary stop hunts. If price breaches the head, the entire QML structure is invalidated.
💰 Take Profit (TP)
TP1 (High Probability): Secure 50% of profits at the previous Swing Low (the original base).
TP2 (Trend Rider): Let the runner go until it hits the next major Higher Timeframe Demand zone, or use a 161.8% Fibonacci Extension.
Chapter 7: Fake Quasimodo (The Trap)
Not every erratic chart movement forms a QML. If your structural analysis is sloppy, you will end up trading a Fake QML and suffer heavy losses. Avoid these common traps:
- No CHoCH (Structure Intact): If the downward push from the Head fails to create a Lower Low (it merely taps the previous base and bounces), DO NOT trade. The bullish trend is still alive.
- Poor Time/Momentum Factor: The crash creating the Lower Low should be a rapid, aggressive drop (V-Shape or Momentum Drop). If price slowly bleeds downward, the institutional intent is likely missing.
- Mitigated by Higher Timeframes: If the Lower Low crashed directly into a massive Daily or Weekly Demand zone, price may bounce back aggressively, obliterating the QML setup. Always align with Higher Timeframes.
Chapter 8: Applying QML to Automation (EA)
Staring at charts trying to manually spot QML patterns is emotionally draining and prone to human error. As developers, we can convert the pure logic of QML into an automated Algorithm!
By utilizing Arrays in MQL5 to track and sequence the last 5 Fractal High/Low points (L, H, LL, HH, HL) alongside strict CHoCH conditions, our Expert Advisors can flawlessly scan for institutional QML setups 24/5. The system automatically calculates precise Lot Sizes based on the dynamic Stop Loss distance above the Head.