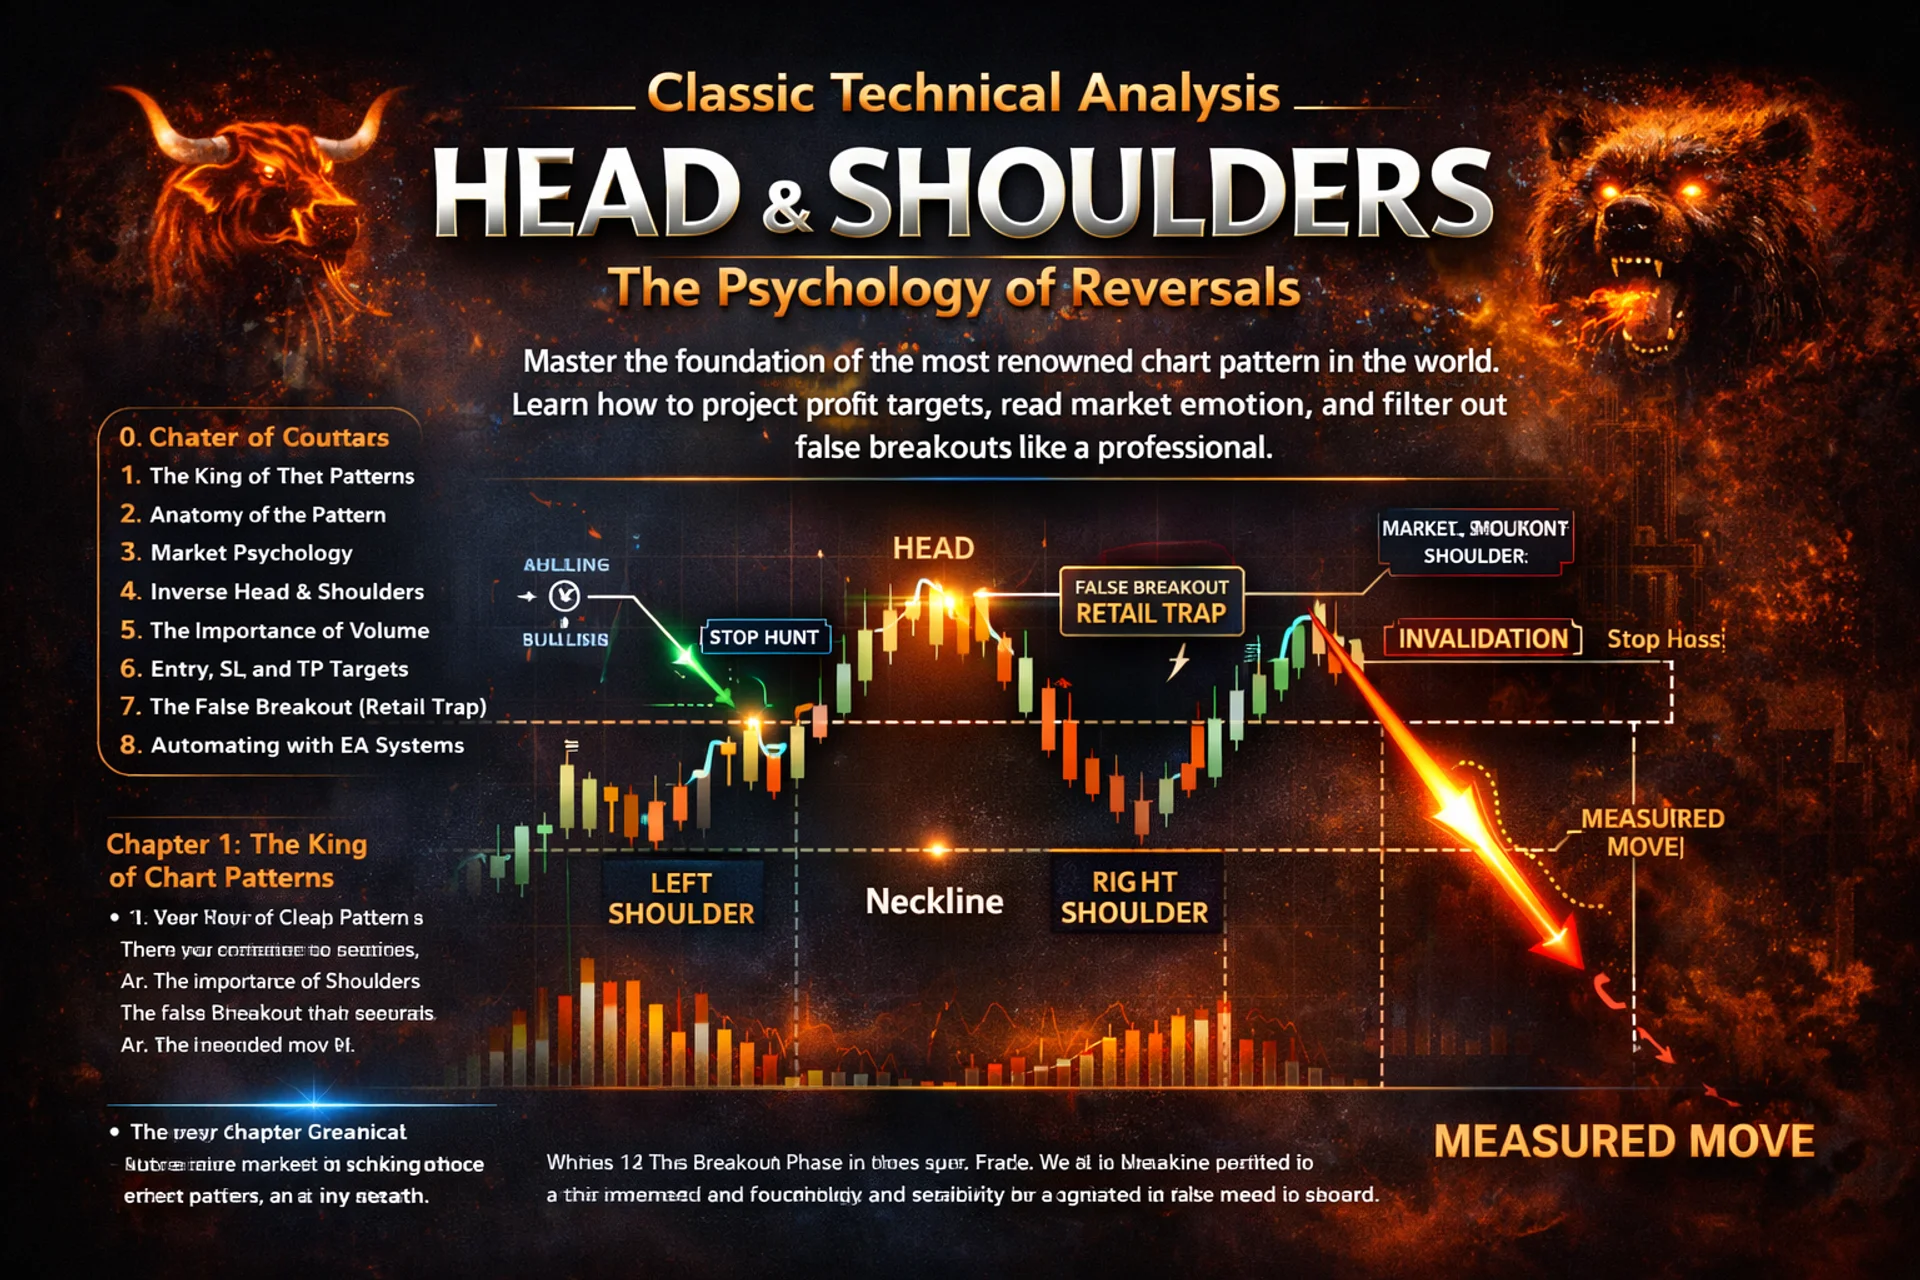
Chapter 1: The King of Chart Patterns
In the realm of Technical Analysis, if one were to name the most classic, widely recognized, and historically utilized chart pattern, it would undoubtedly be the Head and Shoulders (H&S).
Categorized as a Reversal Pattern, it typically manifests at the final stages of a trend (Trend Exhaustion). It serves as an early warning signal that the prevailing trend is losing momentum and preparing to change direction. Even with the advent of modern concepts like Smart Money Concepts (SMC) or advanced Price Action, understanding the H&S pattern remains a crucial foundation for any serious trader.
Chapter 2: Anatomy of the Pattern
The standard Head and Shoulders pattern (characterized by three distinct peaks) only occurs in an Uptrend environment. It consists of four primary structural components:
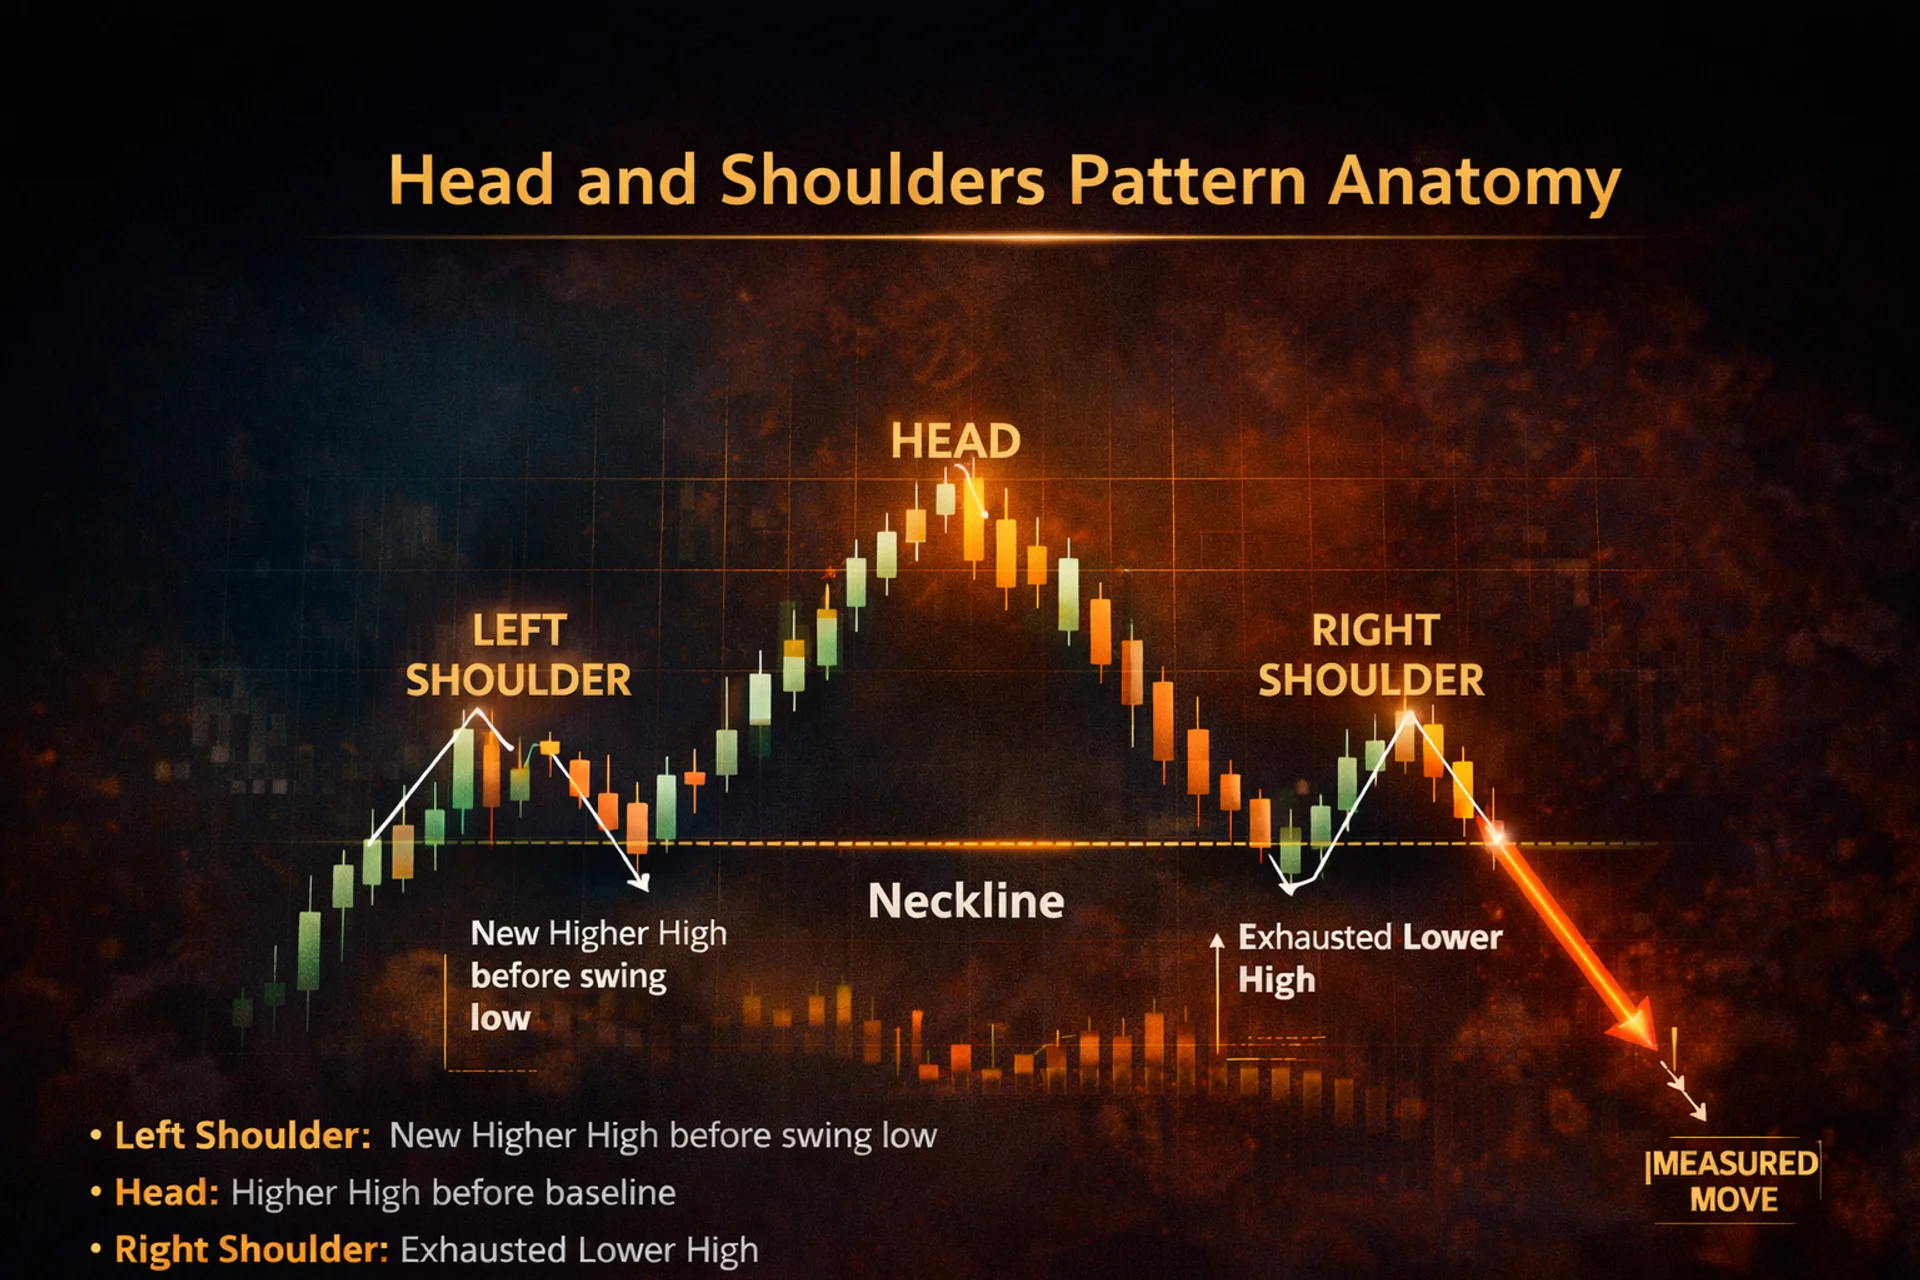
- Left Shoulder: The price creates a new higher high following the standard uptrend structure, before retracing to form a swing low.
- Head: Buying pressure pushes the price back up to create a significant Higher High (substantially taller than the Left Shoulder), before being sold off back down to the baseline.
- Right Shoulder: Buyers attempt to push the price up one last time but are exhausted. They fail to create a new high (forming a Lower High), typically peaking at a level similar to the Left Shoulder.
- Neckline: The definitive support line drawn by connecting the two swing lows (between the Left Shoulder/Head and Head/Right Shoulder). This line is the last line of defense for the uptrend.
Chapter 3: Market Psychology
Charts do not paint themselves; they reflect the raw human emotions of greed and fear. The Head and Shoulders pattern perfectly illustrates this emotional cycle:
- Left Shoulder: The market is full of hope (Bullish). Bulls are firmly in control.
- The Head: Extreme greed (Climax). Retail traders rush in to buy the breakout, completely unaware that Smart Money (Institutions) are beginning their Distribution phase (offloading their positions). This heavy selling pressure forces the price down.
- Right Shoulder: Retail traders attempt to "buy the dip," hoping for continuation. However, institutional backing is gone. Buying momentum dries up (Exhaustion), causing the price to stall and drop.
- Neckline Break: Fear takes over (Panic). Investors holding Long positions surrender and hit their stop losses simultaneously, causing a violent downward cascade.
Chapter 4: The Inverse Head & Shoulders
The exact opposite of the standard pattern is the Inverse Head and Shoulders. This acts as a Bullish Reversal pattern, transitioning a downtrend into an uptrend, and is typically found at absolute market bottoms.
The Inverse Structure
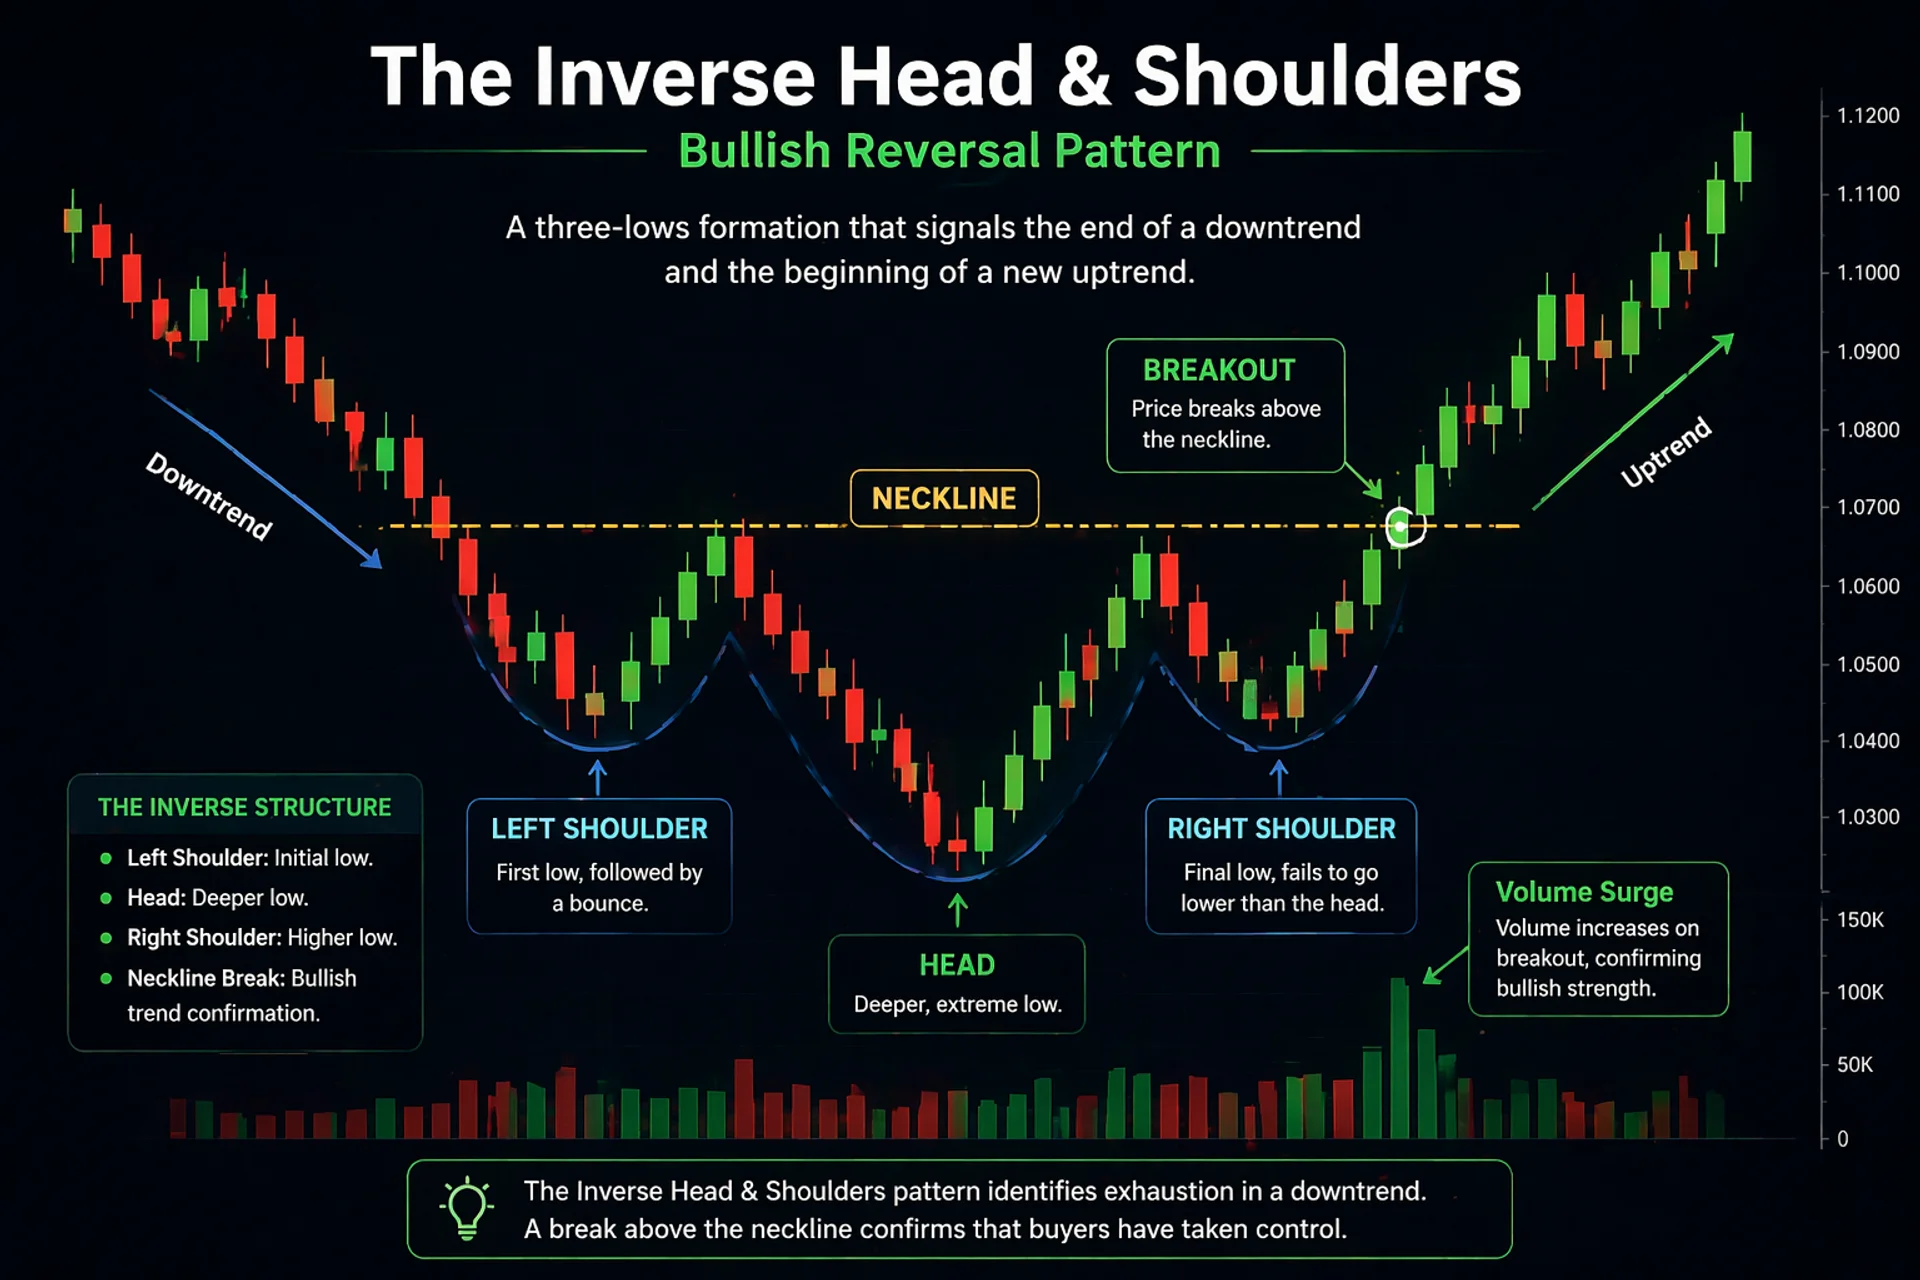
The mechanics mirror the standard pattern. The price creates an initial low (Left Shoulder), plunges to a deeper, extreme low (Head), and makes a final, failed attempt to push lower (Right Shoulder). Once the price breaks above the Neckline resistance, a new bullish trend is confirmed.
Chapter 5: The Importance of Volume
In classical Technical Analysis, confirming whether a Head & Shoulders pattern is genuine or a fakeout heavily relies on Volume (in the Forex market, Tick Volume is used as a reliable proxy).
A textbook perfect pattern displays the following characteristics: Volume is highest during the formation of the Left Shoulder. It noticeably decreases during the formation of the Head (indicating that despite the new high, buying power is waning). Finally, volume dries up on the Right Shoulder. The most critical moment is the breakout: When the price pierces the Neckline, there must be a massive surge in volume to validate the panic selling.
Chapter 6: Entry, SL, and TP Targets
Once the pattern is identified, traders utilize the "Measured Move" technique, a universal standard for pattern trading:
- Entry Point: Execute a Sell (Short) order when a candle definitively closes below the Neckline (Breakout). For a more conservative approach, wait for the price to pull back and retest the Neckline as new resistance (Retest).
- Stop Loss (SL): Place the stop loss slightly above the Right Shoulder. If the price rallies and breaks above the Right Shoulder, the pattern is technically Invalidated.
- Take Profit (TP): To calculate the profit target, measure the vertical distance (height) from the peak of the Head down to the Neckline. Project this exact distance downward from the point of the Neckline breakout. This serves as your minimum objective (TP1).
Chapter 7: The False Breakout (Retail Trap)
Because this pattern is so widely recognized by retail traders, the Neckline often becomes a massive Liquidity Pool. Market Makers exploit this through what is known as the Quasimodo (QML) Theory.
The Stop Hunt Trap
Frequently, the price will pierce the Neckline slightly to bait retail traders into opening Short positions early. Institutional algorithms will then aggressively whip the price back up (Stop Hunt) to trigger the Stop Losses resting above the Right Shoulder, before finally dropping in the intended direction. To counter this, always wait for a Full Body Close below the Neckline on higher timeframes (H4 or D1), or use additional technical filters.
Chapter 8: Automating with EA Systems
While the Head and Shoulders pattern is incredibly powerful, waiting for all four structural components to align requires immense patience and discipline. Often, traders allow emotions to dictate their actions, "forcing" a pattern to fit when the structure is still incomplete.
Eliminate Emotion. Elevate with AI.
Leave the complex task of Market Structure mapping—such as H&S, QML, and Support/Resistance zones—to mathematical algorithms. NB Algo Trade offers Expert Advisors (EA) capable of analyzing structural geometry and filtering out false breakouts with advanced Multi-Timeframe logic.